
Introduction
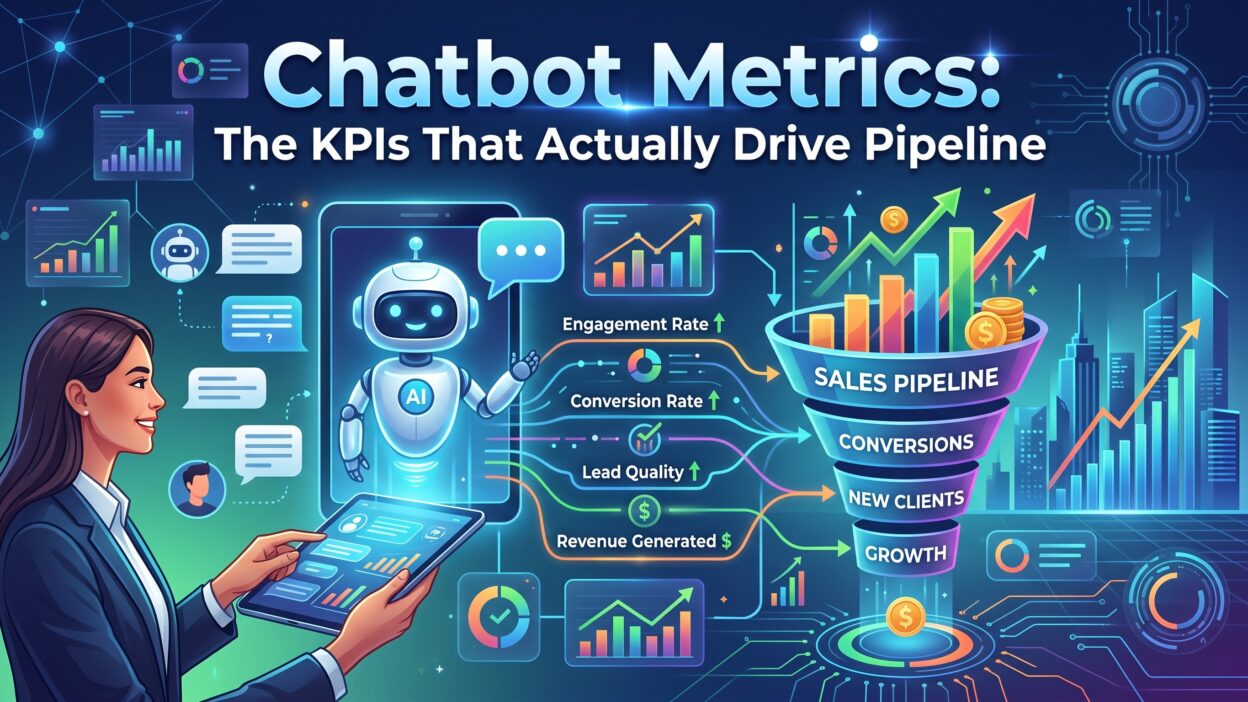
Most teams track the wrong numbers. A chatbot dashboard fills up with chat volume and message counts, yet nobody can say how much pipeline the bot actually created. Chatbot Metrics only matter when they tie back to real revenue outcomes. This guide walks through the exact KPIs that connect chat activity to booked meetings, qualified leads, and closed deals.
You will learn which Chatbot Metrics deserve a spot on your dashboard and which ones waste your team’s attention. You will also learn how to build a simple reporting system that shows marketing and sales leadership the real impact of your chat program.
This guide works for teams running a simple rule-based bot and teams running an advanced AI-driven assistant alike. The specific tool matters less than the discipline behind your measurement approach. Get your Chatbot Metrics framework right first, then apply it to whatever platform your team already uses.+
What Are Chatbot Metrics
Chatbot Metrics measure how a chat tool performs across every stage of a conversation. Some metrics track engagement, like how many visitors start a chat. Other metrics track outcomes, like how many chats turn into a booked meeting.
Most teams start with basic volume numbers. Total conversations. Total messages sent. These numbers feel important at first glance, but they rarely explain whether your bot actually helps close deals.
Strong Chatbot Metrics connect activity to revenue. A bot that starts a thousand conversations but books zero meetings offers little real value. A bot that starts two hundred conversations and books forty meetings delivers real pipeline impact, even with lower volume.
This guide splits Chatbot Metrics into two groups. Pipeline metrics show direct revenue impact. Engagement metrics show how well your bot holds attention and moves visitors through a conversation. Both groups matter, but pipeline metrics deserve the most attention from any team accountable for revenue.
Who Should Own Chatbot Metrics Reporting
Marketing operations usually owns the chatbot platform itself. Sales operations usually cares most about lead quality and conversion. Both teams need visibility into the same Chatbot Metrics dashboard, since chat sits right at the handoff point between marketing and sales.
Why Most Teams Track the Wrong Chatbot Metrics
Vanity metrics feel good on a slide deck. A chart showing chat volume climbing month over month looks impressive in a leadership meeting. This chart says nothing about whether those chats produced real business results.
Chat platforms often push volume metrics by default because they are easy to calculate. Total sessions. Total messages. Average chats per day. None of these numbers require any connection to your CRM or your pipeline data.
Real Chatbot Metrics require integration work. Someone needs to connect chat data to your CRM so a chat conversation links to an actual contact record and an actual deal. Many teams skip this step because it takes more setup time than pulling a native chat report.
This shortcut creates a reporting gap. Marketing reports chat volume as a win. Sales reports chat-sourced leads as low quality. Nobody can settle the disagreement because nobody tracks Chatbot Metrics all the way through to a closed deal.
Fixing this gap starts with a mindset shift. Every Chatbot Metrics conversation should start with a simple question. Does this number tell us something about revenue? If the answer is no, that metric belongs in a secondary report, not your main dashboard.
Chatbot Metrics That Actually Drive Pipeline
These seven Chatbot Metrics tie directly to pipeline and revenue. Track these first before you look at any engagement metric.
Conversation to Qualified Lead Rate
This metric shows what percentage of total conversations turn into a qualified lead. A qualified lead means the visitor met your criteria for budget, need, and timeline through the chat flow.
Calculate this rate by dividing qualified leads by total conversations. A bot that starts five hundred conversations and qualifies fifty leads holds a ten percent qualification rate. This number tells you whether your bot asks the right questions at the right moment.
Low qualification rates often point to weak bot scripting. Your bot might ask generic questions that fail to filter serious buyers from casual browsers. Review your qualifying questions regularly and adjust based on what your best-fit customers actually say during real conversations.
This metric also helps justify chat program budget to leadership. A clear percentage tied to lead quality speaks louder than a raw conversation count ever could.
Meeting Booked Rate
This metric tracks what percentage of qualified conversations result in a booked meeting. A high meeting booked rate shows your handoff from bot to calendar works smoothly.
Many teams lose qualified leads at this exact step. A bot qualifies a strong lead, then asks the visitor to fill out a separate form to schedule a call. This extra friction costs you meetings you already earned through the conversation itself.
Connect your scheduling tool directly inside the chat flow to protect this metric. A visitor should book a time without leaving the chat window at all. Teams that remove this friction usually see a meaningful lift in booked meetings within the first month.
Track this rate separately from your qualification rate. A team might qualify leads well but lose them at the booking step, and this metric isolates exactly where the breakdown happens.
Chat to Opportunity Conversion Rate
This metric measures how many chat-sourced leads become real sales opportunities inside your CRM. A lead can look qualified during a chat and still fail to become an opportunity once a rep reviews the full context.
This gap often reveals a mismatch between your bot’s qualifying questions and your sales team’s actual criteria. Sit both teams down together and compare notes. Adjust your bot script until the leads it passes align with what sales actually wants to work.
A quarterly script review works well for most teams. Pull ten recent chat transcripts that led to closed-lost opportunities and read through them together. Patterns usually emerge quickly once both teams look at real examples side by side instead of arguing over abstract impressions.
Track this Chatbot Metrics number monthly rather than weekly. Opportunity creation often lags behind the original chat conversation by several days, so weekly numbers can look noisy and misleading.
Cost Per Qualified Conversation
This metric divides your total chat program cost by the number of qualified conversations it produces. Include platform subscription fees, any paid traffic driving visitors to chat, and staff time spent managing the bot.
Compare this number against your cost per qualified lead from other channels like paid search or outbound sales development. A chat program that costs less per qualified conversation than your other channels deserves more investment and more traffic.
This metric matters most during budget planning season. Leadership rarely approves increased spend based on conversation volume alone. A clear cost efficiency number makes your budget request far easier to defend.
Response Time
This metric tracks how quickly your bot or a live rep responds to the first message in a conversation. Visitors abandon chat quickly when a response takes too long, so this number directly affects every other metric on this list.
A bot should respond within seconds. A live rep handoff should happen within a minute or two during business hours. Teams that miss these benchmarks see qualification and booking rates drop noticeably.
Segment this metric by time of day and day of week. Response times often slip during high traffic periods or right before a shift change, and this segmentation shows exactly when your coverage needs improvement.
Revenue Influenced by Chat
This metric connects closed deals back to an original chat conversation somewhere in the buyer’s journey. A deal might close months after the first chat message, so this attribution requires solid CRM tracking from the very first touchpoint.
Multi-touch attribution models work better here than simple first-touch or last-touch models. A chat conversation early in the funnel deserves partial credit even when a different channel drives the final conversion step.
This metric gives your chat program its strongest seat at the revenue table. A dollar figure tied to closed deals speaks a language every executive understands immediately.
Sales Cycle Length for Chat-Sourced Leads
This metric compares how long chat-sourced deals take to close against deals sourced through other channels. Chat often shortens sales cycles because it captures buyer intent at the exact moment interest peaks.
Track this Chatbot Metrics number over a full quarter to smooth out normal deal-to-deal variation. A consistent pattern of shorter cycles gives your team another strong argument for continued chat investment.
Chatbot Metrics for Engagement and Conversation Quality
Pipeline metrics show outcomes. Engagement metrics show why those outcomes happen. Track these Chatbot Metrics as supporting context, not as your primary success measure.
Chat Open Rate
This metric shows what percentage of website visitors open a chat window when it appears. A low open rate might mean your chat prompt lacks a compelling reason to click, or it might mean your bot appears on the wrong pages entirely.
Test different opening messages to improve this number. A generic greeting like “How can we help?” performs worse than a specific offer tied to the exact page a visitor lands on. Personalized triggers based on page content usually lift open rates noticeably.
Average Session Duration
This metric tracks how long a typical conversation lasts from first message to last. A very short session might mean visitors get their answer quickly and leave satisfied, or it might mean they abandon the conversation out of frustration.
Pair this metric with your qualification rate to understand which explanation fits your situation. Short sessions paired with strong qualification rates usually signal an efficient bot. Short sessions paired with weak qualification rates usually signal a bot that loses visitors too early.
Fallback Rate
This metric measures how often your bot fails to understand a visitor’s message and falls back to a generic response. A high fallback rate frustrates visitors and drives them away from the conversation entirely.
Review your fallback logs regularly to spot common phrases your bot fails to recognize. Update your bot’s training data based on these real examples, and this fallback rate should drop steadily over time as your bot learns from real conversations.
Containment Rate
This metric shows what percentage of conversations your bot resolves without any human handoff needed. A high containment rate frees up your sales team’s time for conversations that truly need a human touch.
Balance this metric carefully against your booking and qualification rates. A bot that contains every conversation might also be blocking qualified leads from reaching a real rep too early. The goal sits at a healthy middle ground, not at maximum containment for its own sake.
Drop-Off Point Analysis
This metric identifies the exact question or step where visitors most often abandon a conversation. A sharp drop-off after a specific question usually points to that question feeling too personal or too early in the relationship.
Reorder your bot script based on this data. Move sensitive questions like budget or company size later in the flow, after your bot has already built some rapport through easier questions first.
How to Build a Chatbot Metrics Dashboard
Start with your pipeline metrics at the top of the dashboard. Leadership and sales leaders should see qualification rate, meeting booked rate, and revenue influenced without scrolling past engagement numbers first.
Connect your chat platform directly to your CRM before you build any dashboard. Manual data exports break down quickly and nobody trusts numbers that require constant manual correction. A live integration keeps your Chatbot Metrics accurate without extra weekly effort.
Set a review cadence with your team. Weekly reviews work well for response time and open rate, since these numbers shift quickly based on staffing and traffic. Monthly reviews work better for opportunity conversion and revenue influence, since these numbers need more time to fully develop.
Segment your dashboard by page or campaign source whenever possible. A bot on your pricing page should show different benchmarks than a bot on your blog, since visitor intent differs sharply between these two page types.
Share this dashboard with both marketing and sales regularly. A shared view of Chatbot Metrics prevents the disagreements that come from each team looking at a different, incomplete picture of the same chat program.
Choosing the Right Reporting Tools
Most modern chat platforms offer native reporting for basic engagement numbers. Pipeline metrics usually require a connection to your CRM’s reporting tools instead, since revenue data lives there rather than inside your chat platform itself. Build custom reports inside your CRM that pull chat-sourced contact properties alongside deal stage and close data.
Common Mistakes When Tracking Chatbot Metrics
Many teams report chat volume as their headline number every month. This habit keeps attention on the wrong metric and hides whether the bot actually contributes to revenue. Replace volume as your headline number with qualification rate or revenue influenced instead.
Some teams never segment their Chatbot Metrics by page or traffic source. A single blended number hides which pages actually drive strong chat performance and which pages waste chat resources on low-intent visitors.
Other teams set up tracking once and never revisit it. Bot scripts change. Pages get redesigned. Old tracking setups break silently and nobody notices until a quarterly report shows suspiciously flat numbers. Audit your tracking setup every quarter to catch these silent failures early.
A final common mistake involves comparing chat performance against unrealistic benchmarks pulled from a vendor’s marketing material. Every industry and every audience behaves differently. Build your own baseline during the first few months, then measure improvement against that baseline instead of an outside claim.
FAQs About Chatbot Metrics
Which Chatbot Metrics matter most for a B2B sales team? Meeting booked rate and revenue influenced by chat matter most for B2B teams. These two numbers connect chat activity directly to pipeline and closed revenue.
How often should a team review Chatbot Metrics? Review engagement numbers like response time weekly. Review pipeline numbers like opportunity conversion and revenue influence monthly, since these need more time to develop fully.
What is a good qualification rate for a chatbot? A good rate varies by industry and traffic source, but many B2B teams aim for ten to twenty percent of total conversations reaching qualified status. Build your own baseline first, then set improvement goals from there.
Do Chatbot Metrics differ between B2B and B2C companies? Yes. B2B teams focus heavily on meeting booked rate and opportunity conversion, since deals involve longer cycles and multiple stakeholders. B2C teams often weigh containment rate and session duration more heavily instead.
Can small teams track Chatbot Metrics without a data analyst? Yes. Most CRM platforms include built-in reporting tools that handle this tracking without custom development work. Start with three or four core metrics before you expand into a full dashboard.
What tools help connect chat data to CRM reporting? Most major chat platforms offer native integrations with popular CRM systems like HubSpot and Salesforce. Check your specific chat platform’s integration list before you invest in a separate connector tool.
Getting Marketing and Sales Aligned on Chatbot Metrics
Marketing and sales often disagree about chat program value. Marketing points to conversation volume as proof the program works. Sales points to low deal quality as proof it does not. Both teams look at different pieces of the same picture, so the disagreement never fully resolves on its own.
Bring both teams into one room before you finalize your Chatbot Metrics dashboard. Ask sales to define exactly what a qualified lead looks like in their own words. Ask marketing to explain which engagement signals actually predict a strong qualified lead based on past data. This shared definition prevents the confusion that comes from each team using a different standard.
Set a joint review meeting once a month. Walk through the same dashboard together instead of sending separate reports to separate inboxes. This shared review builds trust and catches problems faster, since a sales rep might notice a data quality issue that a marketer would miss entirely.
Create a simple escalation path for bad leads. When a rep flags a chat-sourced lead as low quality, someone on marketing should review that specific conversation and adjust the bot script if a pattern emerges. This feedback loop keeps your Chatbot Metrics honest and keeps your bot script improving continuously.
Celebrate wins together too. When a chat-sourced deal closes, share that story with both teams during your regular meeting. A concrete example builds far more buy-in than any chart full of percentages ever could.
Documenting Your Chatbot Metrics Definitions
Write down exactly how your team calculates each metric on this list. Store this documentation somewhere both teams can access easily. New hires and new managers should never have to guess how your company defines a qualified conversation or a booked meeting.
Read More:-Performance-Based Hiring: How to Land Top Talent, Fast
Conclusion.

Chatbot Metrics only earn their place on a dashboard when they connect to real pipeline outcomes. Volume numbers feel satisfying but rarely tell your team anything useful about revenue impact. Qualification rate, meeting booked rate, and revenue influenced tell the real story instead.
Build your tracking around these pipeline metrics first. Add engagement metrics as supporting context that helps you understand why your numbers move the way they do. Review your dashboard on a steady cadence and share it openly between marketing and sales.
Strong Chatbot Metrics turn a chat program from a nice-to-have feature into a real revenue channel your leadership team trusts. Start tracking the right numbers this month, and your next budget conversation will look very different.
Your chat program already generates the raw data you need. The work now sits in connecting that data to real outcomes and reviewing it consistently with the teams who depend on it most.