

Introduction
TL;DR Customers rarely announce they plan to leave. They go quiet. They skip logins. They stop answering emails. By the time they cancel, the warning signs have sat in your data for months.
A Customer Health Score catches those signs early. It turns scattered signals into one clear number. That number tells your team who thrives, who drifts, and who needs help today.
Table of Contents
What Is a Customer Health Score?
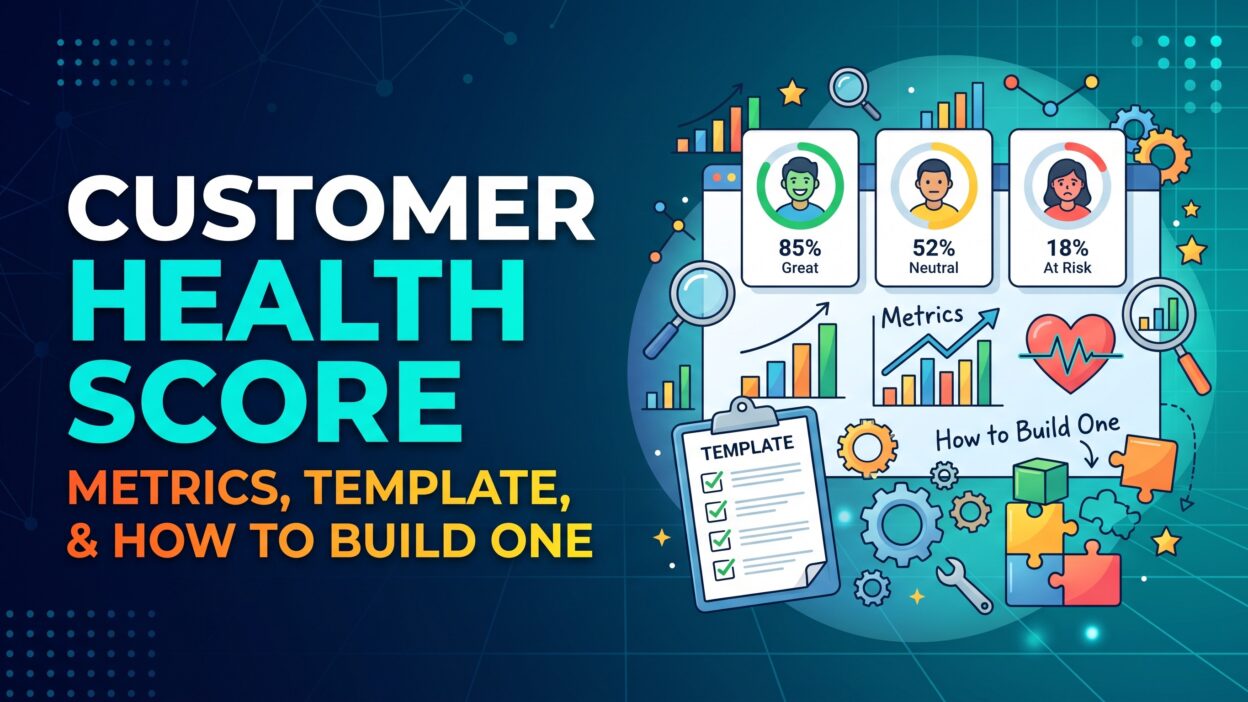
A Customer Health Score is a single rating that shows how likely a customer is to stay, grow, or leave. Teams express it as a number from 0 to 100. Some teams use colors instead. Green means healthy. Yellow means watch closely. Red means at risk.
The score blends several signals. Product usage counts. Support history counts. Payment behavior counts. Relationship strength counts. Each signal gets a weight. The weights add up to one final rating.
What the Score Tells You
The score answers three questions. Will this customer renew? Will this customer buy more? Does this customer need attention now? A good score answers all three at a glance.
Leading and Lagging Signals
Leading signals predict the future. A drop in weekly logins is a leading signal. A missed executive meeting is a leading signal. Lagging signals describe the past. A cancelled contract is a lagging signal. A low renewal rate is a lagging signal. Strong health models lean on leading signals. They give you time to act.
Account Level and User Level
Some teams score whole accounts. Others score each user inside an account. Account scores suit most business-to-business companies. User scores help when many people use the product and champions matter. Start at the account level. Add user detail later.
Health Score Versus Churn Prediction
A health score is simple. People read it in seconds. A churn prediction model is statistical. It outputs a probability. Many teams begin with a health score and graduate to prediction as data grows.
Why a Customer Health Score Matters
Retention drives growth. Keeping a customer costs far less than winning a new one. A Customer Health Score protects that revenue by pointing your team at the right accounts at the right time.
It Replaces Gut Feel
Customer success managers carry many accounts. They cannot track every login or ticket. Gut feel fills the gaps. Gut feel misses quiet customers. A score checks every account every day.
It Focuses Limited Time
A manager with sixty accounts needs a priority list. The score ranks accounts by need. Managers call red accounts first. They nurture yellow accounts next. They celebrate green accounts and look for upsell chances.
It Predicts Renewals
Finance leaders want accurate forecasts. Health data improves them. A pipeline full of green accounts forecasts well. A pipeline full of red accounts signals trouble. Leaders can plan hiring and spending with more confidence.
It Aligns Teams
Sales, support, product, and success all touch customers. A shared score gives them one language. Support knows when a ticket comes from a red account. Sales knows when a green account is ready to expand. Product sees which features green accounts love.
It Surfaces Product Gaps
Patterns emerge across many accounts. If customers who skip one feature turn red, that feature matters. Product teams use these patterns to guide the roadmap.
Core Metrics Behind a Customer Health Score
Metrics form the foundation. Choose signals that predict outcomes in your business. Start with five groups.
Product Usage Metrics
Usage tells the clearest story. Track login frequency, daily and weekly active users, and the share of licensed seats in use. Track adoption of key features. Pick the two or three actions that link to value. A project tool might track projects created. A finance tool might track reports run.
Watch trends, not just totals. A customer with high usage that falls fast needs a call. A customer with modest usage that rises is growing.
Engagement and Relationship Metrics
People matter. Track how often your team meets the customer. Track whether an executive sponsor exists. Track whether the champion still works at the company. Track attendance at webinars, training sessions, and business reviews. Strong relationships protect accounts during rough patches.
Support and Service Metrics
Support data shows friction. Track ticket volume, severity, and time to resolution. Track repeat issues. Track escalations. A burst of tickets can signal frustration. A sudden silence can signal disengagement. Read both.
Sentiment Metrics
Surveys capture how customers feel. Net Promoter Score measures loyalty. Customer Satisfaction Score measures happiness after an interaction. Customer Effort Score measures how hard tasks feel. Add call notes and email tone when you can. Humans often sense risk before the data shows it.
Financial and Contract Metrics
Money signals matter too. Track payment delays, billing disputes, and contract size. Track time to renewal. Track expansion history. A customer that downgrades or asks for discounts may feel doubt. A customer that adds seats shows trust.
Outcome Metrics
The best signal asks whether the customer achieves their goal. Record the goal at onboarding. Track progress against it. A customer who hits their target stays. A customer who never sees results leaves, no matter how often they log in.
Choose Fewer Metrics
More metrics do not mean better scores. Too many inputs create noise. Pick five to ten measures. Choose ones you can collect reliably. Choose ones that link to renewal in your own history.
Check Your Data Sources
Pull data from your product analytics, CRM, support desk, billing system, and survey tools. Confirm that account names match across systems. Duplicate and mismatched records ruin scores. Clean the basics before you build.
How to Build a Customer Health Score Step by Step
Building a score takes weeks, not months. Follow a clear process.
Define the Goal
Decide what the score predicts. Most teams aim at renewal. Some aim at expansion. Pick one primary goal. Write it down. Everything else flows from it.
Study Past Customers
Look at customers who renewed and customers who left. Compare their behavior in the six months before the decision. Find the signals that separated the two groups. Low logins may stand out. Missing executive contact may stand out. These patterns become your inputs.
Select Your Inputs
Choose five to ten metrics from the earlier section. Match each to your findings. Drop any metric you cannot measure well.
Set Scoring Rules
Convert each metric into points. Define what counts as strong, average, and weak. For weekly active users, you might award full points above seventy percent of seats. Award half points between forty and seventy percent. Award none below forty. Use your history to set thresholds.
Assign Weights
Give more weight to metrics that predict renewal best. Usage often carries the most weight. Relationship and support follow. Financial signals usually carry less. The next section covers weighting in detail.
Calculate and Group
Multiply each metric score by its weight. Add the results. You now have a number from 0 to 100. Set cut-offs for green, yellow, and red. Test the cut-offs against past accounts.
Test Against History
Run your Customer Health Score on last year’s accounts. Check whether red accounts churned more often than green accounts. If the result looks flat, adjust. A model that cannot separate winners from losers needs work.
Launch and Train
Show the score inside the CRM or customer success platform. Train managers on how to read it. Explain each component. Managers trust a score they understand.
Review Every Quarter
Business changes. Products change. Customers change. Revisit weights and thresholds each quarter. Keep a changelog.
How to Weight Your Customer Health Score
Weights decide what matters. A poor weighting plan hides risk.
Start With Simple Weights
Begin with round numbers. A common split gives usage thirty-five percent, engagement twenty percent, support fifteen percent, sentiment fifteen percent, and financial signals fifteen percent. Simple weights make debate easy. Teams understand them quickly.
Use Data to Adjust
Run a basic analysis. Check how strongly each metric links to renewal. Raise weights for strong predictors. Lower weights for weak ones. A simple correlation table can guide you. A data analyst can run a regression for deeper insight.
Adjust for Segments
Different customers behave differently. Enterprise accounts rely on relationships. Small business accounts rely on product usage. Build separate weight sets for each segment when your data supports it.
Avoid Overfitting
A model that fits last year perfectly may fail next year. Keep rules simple. Test on a fresh group of accounts. Prefer a stable model to a clever one.
Include a Manual Override
Humans know things data misses. Let managers flag an account as at risk with a short note. Track overrides. Frequent overrides signal weak scoring rules.
Customer Health Score Template
Use this simple template as a starting point. Adapt it to your product.
The Structure
The template scores five categories out of 100 points total. Product usage earns up to 35 points. Engagement earns up to 20 points. Support health earns up to 15 points. Sentiment earns up to 15 points. Financial health earns up to 15 points.
Scoring Each Category
For usage, award points based on active users and key feature adoption. Full points go to accounts where most licensed seats log in each week and the team uses the core feature often. For engagement, award points for recent meetings, an active executive sponsor, and training attendance. For support, award full points when tickets stay low and resolve fast. Remove points for open escalations and repeat issues. For sentiment, award points based on the latest Net Promoter Score and survey feedback. For financial health, award points for on-time payments, stable contract size, and a clear renewal path.
Setting the Ranges
Treat 80 to 100 as green. Treat 60 to 79 as yellow. Treat anything below 60 as red. Adjust these lines after you test against history.
A Worked Example
Picture an account with strong usage worth 30 points. Engagement gives 12 points because the sponsor left. Support gives 10 points because of two recent escalations. Sentiment gives 12 points. Finance gives 15 points. The total reaches 79. The account lands in yellow. The manager sees the weak spots and plans a sponsor reset.
Fields to Store
Store the total score, each category score, the date of calculation, the trend over thirty days, and the top reason for any drop. Reasons help managers act quickly.
Where to Keep the Template
A spreadsheet works for a first version. Move to a customer success platform as account volume grows. Keep the logic documented in one place.
Customer Health Score by Segment and Lifecycle
One model rarely fits every customer. Segment your base for sharper insight.
By Customer Size
Large accounts have many users and many stakeholders. Executive alignment matters most. Small accounts have fewer users. Product usage tells most of the story. Weigh signals to match.
By Product or Plan
Customers on different plans use different features. A score built for your premium plan will misjudge your starter plan. Build separate rules for each.
By Lifecycle Stage
New customers need different checks than veteran customers. In the first ninety days, score onboarding progress. Track time to first value, setup completion, and training attendance. After onboarding, shift weight toward ongoing usage and outcomes. Near renewal, add weight for stakeholder sentiment and contract status.
By Industry
Industries follow different rhythms. A school buys at the start of the year. A retailer slows after the holidays. Seasonal swings can fool a rigid score. Compare each account against its own pattern.
Segmenting adds work. Start with one split, such as enterprise and small business. Expand when the first split proves its value.
How to Act on a Customer Health Score
A score without action is a dashboard decoration. Pair every status with a playbook.
Red Accounts
Red demands quick response. Assign an owner within a day. Review the reasons for the low score. Call the customer. Listen first. Offer a recovery plan with clear steps and dates. Involve an executive for large accounts. Track progress weekly.
Yellow Accounts
Yellow needs gentle attention. Send targeted help based on the weak area. Offer training when usage lags. Offer a business review when engagement slips. Fix small problems before they grow.
Green Accounts
Green earns recognition and growth. Ask for reviews and referrals. Share case study opportunities. Suggest relevant add-ons. Healthy customers often welcome expansion.
Trigger Alerts
Set automatic alerts for sharp drops. A fall of twenty points in a month deserves a flag. Send alerts to the account owner and the manager. Quick alerts beat monthly reports.
Run Weekly Reviews
Hold a short weekly meeting. Review the red list. Assign next steps. Check results from last week. Consistent habits turn the score into outcomes.
Close the Loop
Record what actions worked. Feed that knowledge into future playbooks. Over time, your team learns which fix solves which problem.
Tools for Building a Customer Health Score
Pick tools that match your size and budget.
Spreadsheets
Spreadsheets suit small teams. Export data weekly. Apply formulas. Build a simple dashboard. This path costs little and teaches the logic. It breaks down as accounts multiply.
Customer Success Platforms
Platforms such as Gainsight, ChurnZero, Totango, and Vitally connect to many data sources. They calculate scores automatically. They trigger playbooks and alerts. They cost more. They save time at scale.
CRM Add-Ons
Many CRMs offer health fields and dashboards. These options keep data in one place. They offer less depth than dedicated platforms.
Business Intelligence Tools
Teams with data analysts can build scores in a warehouse and display them in a business intelligence tool. This path gives full control. It demands technical skill.
What to Check Before You Buy
Confirm integrations with your product analytics, support, and billing tools. Ask how flexible the scoring rules are. Ask about alerts and reporting. Run a pilot with real accounts before you sign.
Common Mistakes to Avoid
Teams repeat the same errors. Skip them.
Tracking Too Many Metrics
Long lists create noise. Keep the model lean. Five to ten inputs cover most needs.
Trusting Activity Over Outcomes
Logins show activity. They do not show results. A customer can log in daily and still fail to reach their goal. Include outcome measures.
Setting It and Forgetting It
Markets shift. Products evolve. A stale Customer Health Score misleads managers. Review it every quarter.
Ignoring Data Quality
Bad data produces bad scores. Fix duplicates, missing fields, and mismatched accounts. Assign a data owner.
Hiding the Logic
Managers distrust black boxes. Document how the score works. Show each component on the account page. Explain changes in plain words.
Skipping Validation
Never launch without testing against history. A score that fails to separate churned accounts from renewed accounts has no value.
Forgetting Context
A red score may reflect a one-time event. A budget freeze or a merger can distort data. Let managers add notes. Treat the score as a guide, not a verdict.
Measuring but Not Acting
The biggest mistake is inaction. Pair each status with owners, playbooks, and deadlines. Results follow action, not dashboards.
Frequently Asked Questions
What is a Customer Health Score in simple terms?
It is a number that shows how well a customer is doing with your product. A high number means the customer will likely stay. A low number means the customer may leave.
What is a good Customer Health Score?
It depends on your scale and model. On a scale of 100, most teams treat 80 and above as healthy. Scores from 60 to 79 call for attention. Scores below 60 signal risk. Set your own ranges after testing against past renewals.
Which metrics matter most?
Product usage usually matters most. Relationship strength, support history, sentiment, and financial behavior follow. Pick the ones that predict renewal in your own data.
How often should I update the score?
Update it daily when you can. Usage data changes fast. At the least, refresh it weekly. Review the model itself every quarter.
Who owns the score?
Customer success usually owns it. Revenue operations often builds and maintains it. Product, support, and finance supply data. Name one clear owner.
Can small companies build one?
Yes. A spreadsheet and five metrics are enough to begin. Start simple and grow the model over time.
How is a health score different from NPS?
Net Promoter Score measures one thing: loyalty. A health score blends many signals, including NPS. NPS is one input to the larger picture.
How long does it take to build one?
A basic version takes two to four weeks. Testing and tuning continue for months. Treat the model as a living tool.
Does it predict churn accurately?
It gives a useful estimate, not a guarantee. Accuracy improves as you test, tune, and add better data.
Read More:-Sales Pipeline Health: How to Measure It and Rescue At-Risk Deals
Conclusion

Churn rarely arrives without warning. The signals show up in usage, support, sentiment, and relationships. A Customer Health Score gathers those signals into one clear view and tells your team where to act.
Build yours with a simple plan. Define the goal. Study past customers. Choose five to ten metrics. Set scoring rules and weights. Test against history. Launch with training. Review every quarter.
Use the template in this guide as a starting point. Adapt the categories to your product. Segment your customers when the basics work. Pair every color with a playbook so the score drives action.
Protect data quality. Keep the logic visible. Let managers add context. Avoid the trap of measuring without acting.