
Introduction
TL;DR Every founder asks one question before building a product. Will enough people buy this? TAM analysis gives you that answer. It shows the real size of your market. It tells investors your business has room to grow. This guide walks you through every step of TAM analysis. You will learn the formulas. You will learn the methods. You will learn the mistakes to avoid. By the end, you can run your own TAM analysis with confidence.
Table of Contents
What Is TAM Analysis?
TAM stands for Total Addressable Market. TAM analysis measures the total revenue opportunity for a product or service. It answers one simple question. How much money could you make if you captured 100% of your market? Startups use TAM analysis to prove their idea has scale. Investors use TAM analysis to judge risk and reward. Marketing teams use TAM analysis to plan campaigns and budgets.
TAM analysis is not a guess. It relies on real data. Analysts pull numbers from industry reports, government statistics, and customer surveys. Good TAM analysis blends multiple data sources. This makes the final number trustworthy.
Why TAM Analysis Matters for Your Business
A strong TAM analysis proves your market is big enough to matter. Investors reject pitches with a small market size. A tiny market limits growth. A tiny market limits returns. TAM analysis protects you from this trap.
TAM analysis also guides internal decisions. Product teams use it to prioritize features. Sales teams use it to set territory goals. Finance teams use it to build revenue forecasts. Every department benefits from an accurate TAM analysis.
TAM vs SAM vs SOM Explained
TAM analysis often gets grouped with two related terms. SAM means Serviceable Addressable Market. SOM means Serviceable Obtainable Market. These three metrics work together.
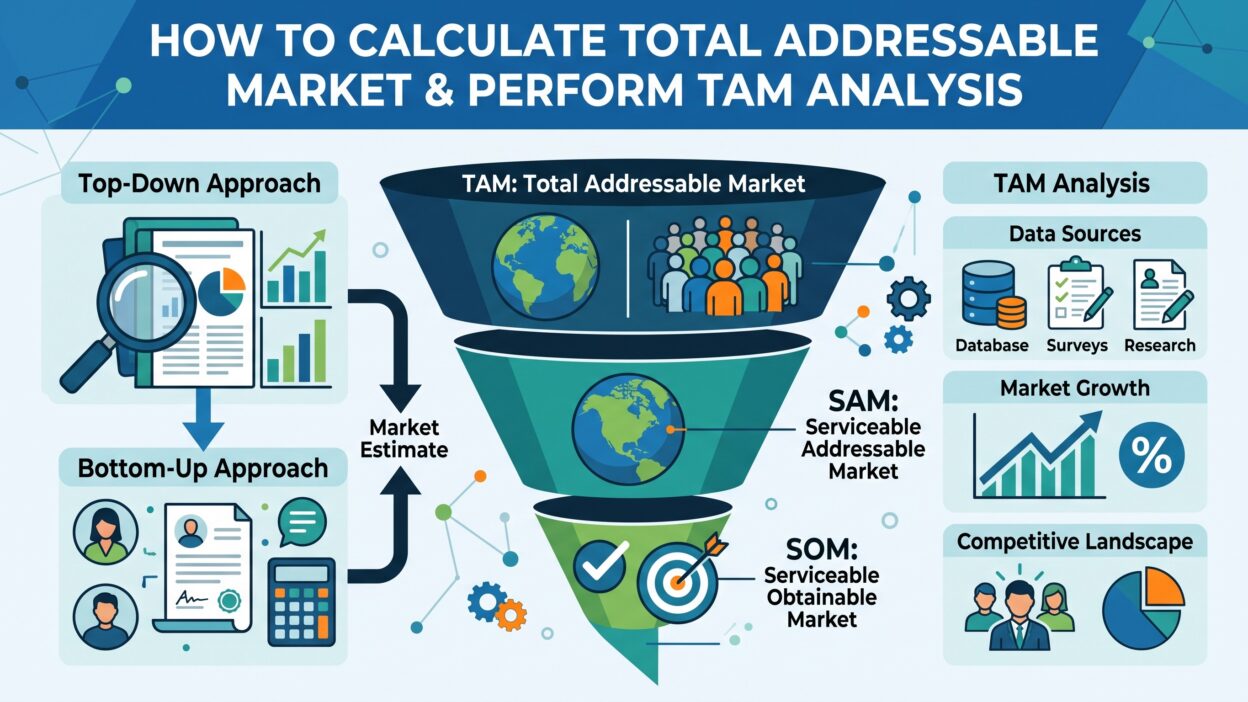
TAM shows the total market. SAM narrows that market to the segment you can actually serve. SOM narrows it further to the share you can realistically win. Picture three circles. The largest circle is TAM. A smaller circle inside it is SAM. The smallest circle is SOM. TAM analysis starts the process. SAM and SOM refine the picture.
Benefits of TAM Analysis
TAM analysis brings clarity to business planning. It helps founders spot real opportunities early. It helps founders avoid markets that look promising but stay too small.
TAM analysis strengthens fundraising pitches. Investors want proof of scale. A detailed TAM analysis gives them that proof. It shows you understand your industry deeply.
TAM analysis also improves resource allocation. Teams stop guessing where to spend money. They point resources toward the biggest opportunities. This saves time. This saves budget. This reduces wasted effort across the company.
TAM analysis supports long-term strategy too. Markets shift over time. Regular TAM analysis tracks these shifts. Companies adjust their plans before competitors notice the change.
How to Calculate Total Addressable Market
You can calculate Total Addressable Market through three proven methods. Each method fits different business types. Pick the one that matches your data and industry.
Top-Down Approach
The top-down approach starts with broad industry data. Analysts pull numbers from research firms like Gartner or Statista. They take the total industry revenue figure. Then they narrow that figure down to their specific segment.
This method works fast. It uses existing reports instead of new research. But it carries a risk. Broad industry numbers sometimes miss local nuances. A global report may not reflect regional demand accurately. Use this method for a quick estimate. Pair it with other methods for precision.
Bottom-Up Approach
The bottom-up approach builds your TAM analysis from real customer data. You start with your average revenue per customer. You multiply that number by your total potential customer count.
This formula looks simple. Average Revenue Per Customer times Total Number of Potential Customers equals your TAM. Say your average customer pays $500 per year. Say your market has 100,000 potential customers. Your TAM equals $50 million.
Bottom-up TAM analysis produces more accurate numbers. It relies on your own pricing and customer data. It avoids the guesswork of industry-wide reports. Most experienced analysts prefer this method for serious TAM analysis.
Value Theory Approach
The value theory approach estimates market size based on the value your product delivers. You calculate how much value customers gain from your solution. Then you estimate what percentage of that value customers will pay for your product.
This method suits new categories without existing market data. It works well for disruptive products. It requires strong assumptions about customer behavior. Use this approach only when other data sources stay unavailable. Combine value theory with bottom-up numbers whenever possible. This combination produces a stronger TAM analysis.
Step-by-Step Guide to Perform TAM Analysis
Follow these steps to run a complete TAM analysis for your business.
Define Your Target Market
Start your TAM analysis with a clear market definition. Identify your ideal customer profile. Identify their industry, size, and location. A vague market definition weakens your entire TAM analysis.
Ask yourself who buys your product today. Ask yourself who could buy your product in the future. Write down specific traits. These traits shape every later step of your TAM analysis.
Gather Market Data
Collect data from trusted sources. Government census data offers reliable population and business figures. Industry reports from firms like IBISWorld provide revenue estimates. Trade associations often publish niche market data too.
Survey your existing customers directly. Ask about their budgets and buying habits. This primary data strengthens your TAM analysis far more than secondary reports alone. Combine multiple sources for the most accurate picture.
Choose Your Calculation Method
Pick top-down, bottom-up, or value theory based on your available data. Many analysts run two methods side by side. This comparison checks their TAM analysis for accuracy.
If both methods produce similar numbers, trust the result. If the numbers differ widely, dig deeper. Find out which data source caused the gap. Adjust your assumptions until the numbers align.
Calculate SAM and SOM
After you finish your TAM analysis, narrow the number down. Calculate your SAM by filtering out customers outside your service area or product fit. Calculate your SOM by estimating your realistic market share within the SAM.
A software company might find a $2 billion TAM. Their SAM might shrink to $400 million after removing customers outside their geography. Their SOM might land at $20 million based on current sales capacity. This funnel gives investors a realistic growth path.
Validate Your Numbers
Cross-check your TAM analysis against real sales data. Compare your estimate with competitor revenue figures where available. Public company filings often reveal useful benchmarks.
Update your TAM analysis every year. Markets grow. Markets shrink. New competitors enter. New regulations appear. A static TAM analysis becomes outdated fast. Regular reviews keep your numbers relevant.
Common Mistakes in TAM Analysis
Many founders inflate their TAM analysis to impress investors. This tactic backfires quickly. Experienced investors spot unrealistic numbers within minutes. They question your credibility on every other slide.
Some teams rely on a single data source. This creates a narrow view of the market. Always blend multiple sources for a balanced TAM analysis.
Other teams ignore their SAM and SOM entirely. They present only the TAM figure. Investors want the full funnel. Show them the realistic path from total market to actual revenue.
Outdated data ruins many TAM analysis reports too. Markets change fast in tech and consumer goods. Always use the most recent data available. Label your sources and their publication dates clearly.
Finally, some analysts skip customer validation. They build a TAM analysis purely from desk research. Real conversations with real buyers reveal insights that reports miss. Talk to your customers before you finalize any number.
Tools for TAM Analysis
Several tools speed up your TAM analysis process. Statista offers industry statistics across hundreds of sectors. IBISWorld provides deep industry reports with revenue breakdowns. CB Insights tracks startup funding trends and market maps.
Google Trends helps you gauge search interest in your product category. This signals demand direction over time. SEMrush and Ahrefs reveal keyword volume, which hints at market size for digital products.
Spreadsheet software remains essential for every TAM analysis. Build your formulas in Excel or Google Sheets. Keep your assumptions visible in separate tabs. This transparency helps investors trust your TAM analysis during due diligence.
TAM Analysis Examples
Picture a company selling project management software to small businesses in the United States. The top-down approach starts with the global project management software market, valued in public reports. The analyst narrows this figure to the U.S. small business segment alone.
The bottom-up approach takes a different path. The analyst counts small businesses in the U.S. that fit the ideal customer profile. She multiplies that count by the average annual subscription price. This produces a bottom-up TAM analysis grounded in real pricing data.
Now picture a hardware startup building a new type of solar charger. No direct market report exists for this specific product. The team applies the value theory approach instead. They estimate the cost savings customers gain from the charger. They estimate what portion of those savings customers will pay as a subscription or purchase price. This value-based TAM analysis fills the data gap left by traditional reports.
Each example shows a different path. Each path leads to a defensible market size. Strong TAM analysis always matches the method to the available data.
TAM Analysis for B2B vs B2C Companies
TAM analysis looks different for B2B companies compared to B2C companies. B2B TAM analysis focuses on the number of businesses that fit a buyer profile. Analysts count companies by industry code, employee size, and revenue range. They multiply that count by an average annual contract value.
B2C TAM analysis focuses on individual consumers instead. Analysts count people within a target age group, income bracket, or geographic region. They multiply that count by average annual spending on the product category.
B2B markets often carry fewer buyers but higher deal sizes. A B2B TAM analysis might count only ten thousand target companies. Their combined spending still reaches hundreds of millions of dollars. B2C markets carry many more buyers with smaller individual purchases. A B2C TAM analysis often multiplies millions of potential customers by a modest average purchase price.
Both paths need accurate data. B2B teams should pull data from firms like ZoomInfo or LinkedIn Sales Navigator. B2C teams should pull data from census bureaus and consumer spending surveys. Matching your data source to your business model sharpens every TAM analysis.
Industry-Specific Considerations
Every industry brings its own quirks to TAM analysis. Software companies enjoy abundant public data on subscription pricing and user counts. Healthcare companies face stricter data privacy rules, which limits some data access. Retail companies can pull strong data from government trade statistics.
Regulated industries like finance and healthcare need extra caution. A TAM analysis for a medical device company must account for regulatory approval timelines. These timelines shrink the realistic near-term market even when the total market looks large. A TAM analysis for a fintech startup must account for licensing requirements across different states or countries.
Emerging industries pose a unique challenge too. A brand-new product category often lacks historical sales data. Analysts in this situation lean heavily on the value theory approach described earlier. They estimate demand through customer interviews and pilot programs instead of existing reports.
Using TAM Analysis in Investor Pitch Decks
Investors expect a TAM analysis slide early in every pitch deck. This slide typically appears right after the problem and solution slides. A strong TAM slide shows three numbers together. It shows the TAM, the SAM, and the SOM in one visual funnel.
Keep this slide simple. Avoid cramming too many data points onto one page. Show your top-line TAM figure in large text. Show your calculation method in small text below it. Cite your sources directly on the slide. This builds trust with investors reviewing your deck.
Many founders make the mistake of leading with an enormous global TAM figure. A billion-dollar number sounds impressive at first glance. Sharp investors ask how much of that market you can realistically reach within five years. Always pair your TAM analysis with a believable SOM figure. This combination tells a stronger story than a huge number alone.
Practice explaining your TAM analysis out loud before every pitch meeting. Investors will ask follow-up questions about your assumptions. A founder who understands every number behind their TAM analysis earns more credibility than one reciting a memorized figure.
How TAM Analysis Shapes Long-Term Strategy
TAM analysis does more than support a single fundraising round. It shapes decisions for years after that first pitch. Product roadmaps often follow the direction of a well-built TAM analysis. Teams build features that expand their reach into adjacent segments of the market.
Sales leaders use TAM analysis to plan territory expansion. A company might start selling only in one country. Once the domestic SOM approaches its ceiling, leaders look at the broader TAM analysis for international expansion targets. This staged approach reduces risk while still pursuing the full market opportunity.
Marketing teams also lean on TAM analysis when planning campaigns. A campaign built around a niche segment needs a smaller budget than one built around the full TAM. Marketing leaders check the TAM analysis before setting annual spending targets. This keeps budgets aligned with real opportunity instead of guesswork.
Boards and executives revisit TAM analysis during annual planning cycles too. They compare current revenue against the SOM figure from the prior year. A company closing in on its SOM needs a new growth plan. That plan often starts with a refreshed TAM analysis covering new segments or new geographies.
Presenting TAM Analysis Results to Stakeholders
A strong TAM analysis loses value if nobody understands it. Present your numbers with clear visuals. Use a simple funnel chart to show TAM, SAM, and SOM together. Avoid dense spreadsheets during a live presentation. Save the detailed math for a supporting document.
Explain your assumptions before you show the final number. Stakeholders trust a TAM analysis more when they see the logic behind it. Walk them through your data sources first. Walk them through your formula second. Show the final figure last.
Different stakeholders care about different parts of your TAM analysis. Investors focus on growth potential and market timing. Board members focus on how the number connects to current revenue. Sales leaders focus on the SOM figure and territory planning. Tailor your presentation to the audience in the room.
Keep a written record of every TAM analysis you present. Store your data sources, formulas, and assumptions in one document. This record helps you update the analysis quickly next year. It also helps new team members understand how past decisions took shape.
Related Concepts
TAM analysis connects to several related terms worth understanding. Market sizing describes the broader practice of estimating market opportunity. Serviceable addressable market and serviceable obtainable market narrow the funnel below TAM. Market penetration rate measures how much of the SOM a company actually captures over time.
Competitive analysis often pairs with TAM analysis during investor pitches. Founders show market size first. Then they show how they plan to win share from competitors. This combination builds a complete growth story.
FAQs About TAM Analysis
What is the difference between TAM and market share? TAM measures total market opportunity. Market share measures the portion a company currently holds. TAM analysis sets the ceiling. Market share shows current performance against that ceiling.
How often should a company update its TAM analysis? Most companies update their TAM analysis once a year. Fast-moving industries benefit from quarterly reviews. Regular updates keep your numbers accurate and useful for planning.
Can a small business benefit from TAM analysis? Yes, small businesses gain clarity from TAM analysis too. It helps them spot underserved niches. It helps them set realistic growth targets without industry-wide data overwhelming their plans.
What is a good TAM size for a startup? Most investors look for a TAM above $1 billion. This threshold varies by industry and funding stage. A smaller TAM can still attract funding if the SOM shows strong near-term revenue potential.
Which method gives the most accurate TAM analysis? The bottom-up approach usually produces the most accurate TAM analysis. It relies on your actual pricing and customer counts instead of broad industry estimates.
Do investors always require a TAM analysis? Most investors expect a TAM analysis during due diligence. It proves the market can support their expected returns. Skipping this step weakens any funding pitch significantly.
How long does a proper TAM analysis take to complete? A basic TAM analysis takes a few days for an experienced analyst. A thorough TAM analysis with primary research and validation can take several weeks. The timeline depends on data availability and industry complexity.
Should a TAM analysis include international markets? Include international markets only if your company plans to sell there within a reasonable timeframe. A global TAM analysis looks impressive but loses credibility without a realistic expansion plan attached to it.
Read More:-10 Business Development Strategies for Recruiting
Conclusion

TAM analysis turns guesswork into strategy. It shows founders and investors the true size of an opportunity. Start with a clear market definition. Gather data from multiple trusted sources. Choose the calculation method that fits your business. Narrow your TAM down to SAM and SOM for a realistic growth picture. Avoid inflated numbers and outdated data. Update your TAM analysis every year to stay accurate.
A solid TAM analysis does more than impress investors. It guides product decisions. It guides marketing budgets. It guides long-term company strategy. Master this skill early. Every business decision after that becomes sharper and more confident.
Treat your TAM analysis as a living document, not a one-time exercise. Revisit it after every major product launch. Revisit it after every new market entry. A fresh TAM analysis keeps your team focused on the opportunities that matter most right now. Founders who build this habit make faster decisions and raise funding with far greater ease.