

Introduction
TL;DR Every email campaign tells a story through numbers. Email analytics reveals that story. It shows which subject lines grab attention. It shows which links get clicks. It shows which emails drive real revenue. Marketers who skip email analytics fly blind. Marketers who track email analytics make sharper decisions with every send. This guide breaks down every metric that matters. You will learn what to track. You will learn how to read the numbers. You will learn how to turn email analytics into better campaigns.
Table of Contents
What Is Email Analytics?
Email analytics measures the performance of email campaigns. It tracks opens, clicks, bounces, and conversions. It tracks unsubscribes and spam complaints too. Email analytics turns raw data into clear insight. Marketers use this insight to improve future campaigns.
Email analytics goes beyond a simple open rate. Modern platforms track subscriber behavior across the entire customer journey. They connect email activity to website visits and purchases. This connection makes email analytics a core part of any marketing strategy.
Why Email Analytics Matters for Marketers
Email remains one of the highest return channels in marketing. Email analytics proves that return with hard numbers. It shows exactly which campaigns drive revenue. It shows exactly which campaigns waste budget.
Email analytics also protects sender reputation. High bounce rates and spam complaints hurt deliverability over time. Marketers who watch email analytics catch these problems early. They fix list quality before real damage happens.
Teams use email analytics to justify budget too. A marketing leader with strong email analytics data wins more resources from leadership. Numbers speak louder than opinions in every budget meeting.
Email Analytics vs Website Analytics
Email analytics and website analytics work together but measure different things. Email analytics tracks behavior within the inbox and the first click. Website analytics tracks behavior after a visitor lands on your site.
Picture a subscriber who opens an email and clicks a link. Email analytics stops recording at that click. Website analytics picks up the story from there. It tracks pages viewed, time on site, and final conversion. Smart marketers connect both data sets. This connection gives a full picture of the customer journey.
Benefits of Tracking Email Analytics
Email analytics brings clear benefits to every marketing team. It helps marketers spot trends before they become problems. A dropping open rate signals a subject line issue early. A rising unsubscribe rate signals content fatigue among subscribers.
Email analytics also sharpens segmentation. Marketers use engagement data to split lists into active and inactive groups. This segmentation improves targeting for every future campaign.
Email analytics supports A/B testing too. Marketers compare two subject lines or two send times using real data. The winning version gets identified through email analytics instead of guesswork.
Email analytics improves customer retention as well. Marketers spot subscribers who stop engaging. They send win-back campaigns before those subscribers churn completely. This proactive approach saves customer relationships that would otherwise disappear.
Core Email Analytics Metrics You Need to Track
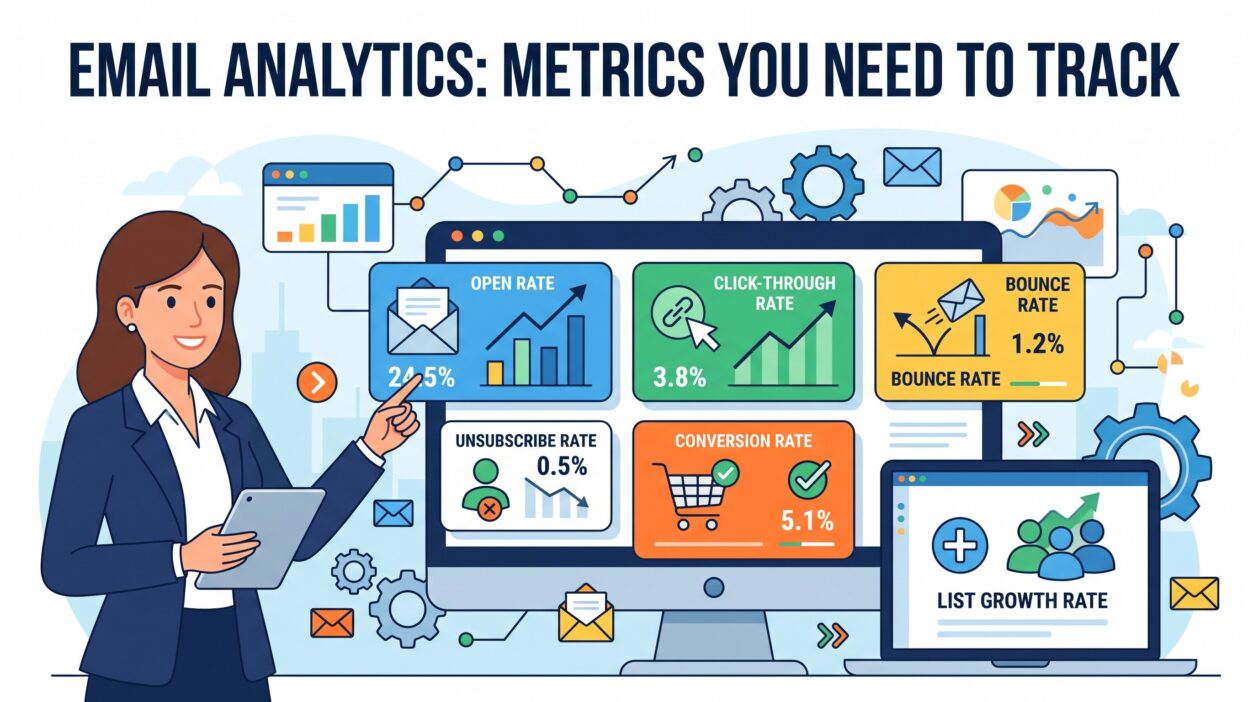
Every email program should track a core set of metrics. These numbers form the foundation of solid email analytics.
Open Rate
Open rate measures the percentage of recipients who open an email. Marketers calculate it by dividing total opens by total emails delivered. Multiply that number by 100 for a percentage.
Open rate remains a popular metric in email analytics despite privacy changes from Apple Mail. These changes inflate open rates through automatic image loading. Treat open rate as a directional signal rather than an exact number. Use it alongside other metrics for a fuller picture.
Click-Through Rate
Click-through rate measures the percentage of recipients who click a link inside an email. This metric shows real engagement more reliably than open rate. Marketers divide total clicks by total emails delivered, then multiply by 100.
Click-through rate reveals content quality within email analytics reports. A high click-through rate signals strong subject lines and relevant content. A low click-through rate signals the need for a creative refresh.
Click-to-Open Rate
Click-to-open rate compares clicks against opens instead of total sends. This metric isolates content performance from subject line performance. Marketers divide total clicks by total opens, then multiply by 100.
This number matters greatly in email analytics because it removes deliverability noise. A campaign can reach many inboxes but still fail if the content inside disappoints readers.
Conversion Rate
Conversion rate measures the percentage of recipients who complete a desired action. This action might be a purchase, a signup, or a download. Marketers divide total conversions by total emails delivered, then multiply by 100.
Conversion rate connects email analytics directly to business revenue. This metric matters most to executives reviewing campaign performance. A strong conversion rate justifies continued investment in email marketing.
Bounce Rate
Bounce rate measures the percentage of emails that fail to reach an inbox. Hard bounces happen when an email address no longer exists. Soft bounces happen when a mailbox stays full or a server has temporary issues.
Bounce rate plays a critical role in email analytics because it affects sender reputation. Internet service providers watch bounce rates closely. A high bounce rate can land future emails in spam folders.
Unsubscribe Rate
Unsubscribe rate measures the percentage of recipients who opt out after an email. This metric reveals content fatigue or targeting mismatches. Marketers divide total unsubscribes by total emails delivered, then multiply by 100.
A small unsubscribe rate stays normal for every campaign. A sudden spike signals a problem worth investigating within your email analytics dashboard.
Spam Complaint Rate
Spam complaint rate measures how many recipients mark an email as spam. This number carries heavy weight with email providers like Gmail and Outlook. A high spam complaint rate damages deliverability across your entire sending domain.
Keep this rate below 0.1% according to most industry standards. Email analytics platforms flag this metric prominently because of its impact on inbox placement.
List Growth Rate
List growth rate measures how fast a subscriber list expands over time. Marketers subtract unsubscribes and bounces from new signups, then divide by total list size. This metric shows whether acquisition efforts outpace list decay.
Email analytics teams track list growth rate alongside engagement metrics. A growing list with dropping engagement signals a need for better welcome sequences and onboarding content.
Revenue Per Email
Revenue per email measures the direct dollar value generated by each email sent. Marketers divide total campaign revenue by total emails delivered. This metric ties email analytics straight to business outcomes.
E-commerce brands rely heavily on this number. It helps them compare campaign performance across product lines and promotional periods.
How to Set Up Email Analytics Tracking
Setting up strong email analytics tracking takes a few deliberate steps.
Choose the Right Platform
Pick an email service provider with built-in analytics dashboards. Platforms like Mailchimp, Klaviyo, and HubSpot offer detailed reporting out of the box. Compare their reporting depth before committing to a long-term contract.
Set Clear Goals for Each Campaign
Define a goal before you send any campaign. A newsletter might aim for engagement. A promotional email might aim for conversions. Clear goals help you choose which email analytics metrics matter most for each send.
Connect Email Data to Your CRM
Link your email platform to your customer relationship management system. This connection lets you track subscriber behavior across multiple touchpoints. Email analytics becomes far more powerful once it connects to purchase history and lifetime value data.
Build Custom Dashboards
Build a dashboard that highlights your most important metrics first. Avoid drowning in vanity numbers. Focus your email analytics dashboard on open rate, click-through rate, conversion rate, and revenue per email.
Review Data on a Regular Schedule
Review your email analytics weekly for tactical adjustments. Review monthly for broader trend analysis. Review quarterly for strategic planning around list segmentation and content direction.
Common Mistakes in Email Analytics
Many marketers focus only on open rate. This narrow view misses the full picture that email analytics can offer. Open rate alone cannot show revenue impact or content quality.
Some teams ignore mobile performance data. Most emails get opened on mobile devices today. Email analytics without a mobile breakdown misses a huge part of subscriber behavior.
Other teams skip segmentation entirely. They read aggregate numbers across their whole list. This approach hides important differences between engaged and disengaged subscriber groups. Break your email analytics down by segment for sharper insight.
Ignoring deliverability metrics causes long-term damage too. Marketers who chase clicks while ignoring bounce and spam rates eventually lose inbox placement. Balance growth metrics with health metrics inside every email analytics review.
Finally, many teams never test their assumptions. They guess at the best send time or subject line style. Strong email analytics comes from consistent testing, not intuition alone.
Tools for Email Analytics
Several tools help marketers track and interpret email analytics data. Mailchimp offers built-in reporting with clear visual dashboards. Klaviyo excels at connecting email data to e-commerce revenue. HubSpot integrates email analytics with broader marketing and sales data.
Google Analytics adds another layer to email analytics through UTM tracking. Marketers tag email links with UTM parameters. This tagging shows exactly how email traffic behaves once it reaches a website.
Litmus and Email on Acid help marketers test rendering across devices before a send. These tools catch formatting issues that would otherwise skew engagement data inside email analytics reports.
Email Analytics Examples in Action
Picture an online retailer sending a weekly promotional newsletter. Email analytics shows a 25% open rate and a 3% click-through rate for a typical send. The team notices a subject line test doubling the click-through rate to 6%. They apply that winning format to future campaigns immediately.
Picture a SaaS company sending onboarding emails to new users. Email analytics shows strong opens but weak conversions. The team digs deeper and finds a broken call-to-action button on mobile devices. They fix the bug and conversions rise by 40% within one week.
Picture a nonprofit organization sending a fundraising appeal. Email analytics reveals a high unsubscribe rate right after the send. The team reviews their list and finds an unsegmented email sent to lapsed donors uninterested in that specific campaign. Better segmentation solves the problem for the next appeal.
Each story shows how email analytics turns raw numbers into real action. Marketers who read their data closely fix problems fast and repeat their wins consistently.
Email Analytics for B2B vs B2C Companies
Email analytics looks different across business models. B2B email analytics tracks longer sales cycles and smaller send volumes. Marketers watch engagement over weeks or months instead of a single campaign. A B2B team might track how many touches an email sequence needs before a lead books a demo.
B2C email analytics tracks faster cycles and larger send volumes. Retail brands watch daily or weekly performance across large subscriber lists. A B2C team cares deeply about revenue per email and immediate conversion behavior.
B2B email analytics often connects to lead scoring systems. Marketing teams assign points based on email opens and clicks. Sales teams use these scores to prioritize outreach. B2C email analytics connects more directly to purchase behavior and cart activity.
Both models benefit from consistent tracking. The metrics that matter most simply shift based on sales cycle length and purchase frequency. Match your email analytics dashboard to your specific business model for the clearest insight.
Industry-Specific Email Analytics Considerations
Different industries lean on different email analytics metrics. E-commerce brands prioritize revenue per email and cart abandonment recovery rates. Media companies prioritize click-through rate since their goal centers on driving traffic back to articles.
Financial services companies face strict compliance rules around email content. Their email analytics must account for lower send frequency and careful subject line testing within legal boundaries. Healthcare organizations face similar constraints tied to patient privacy regulations.
SaaS companies track email analytics closely during onboarding sequences. Early engagement signals predict long-term product adoption. A new user who ignores onboarding emails often churns within the first month. Strong email analytics helps these teams intervene before that churn happens.
Using Email Analytics to Improve Campaign Strategy
Email analytics does more than report past performance. It shapes future campaign strategy directly. Marketers use engagement trends to decide send frequency. A list showing fatigue signals from declining open rates needs fewer emails, not more.
Content teams lean on email analytics to guide topic selection. Articles or promotions with high click-through rates in past campaigns often perform well again in similar formats. This pattern recognition saves time during content planning meetings.
Design teams also benefit from email analytics. Heatmap data inside many platforms shows exactly where subscribers click within an email. Marketers move important calls-to-action toward high-engagement zones based on this data.
Timing decisions improve through email analytics too. Marketers test send times across different days and hours. They track open and click patterns to find the window that generates the strongest response for their specific audience.
Presenting Email Analytics Results to Stakeholders
Strong email analytics data loses impact without clear presentation. Build simple charts that show trends over time rather than raw numbers in a table. A line chart showing open rate across twelve months tells a clearer story than a single monthly figure.
Connect your email analytics directly to business goals when presenting to leadership. Show how campaign revenue compares to the cost of running your email program. This connection proves the channel’s value in terms executives understand immediately.
Different stakeholders care about different metrics within your email analytics report. Sales teams want to see lead engagement and conversion data. Finance teams want to see revenue per email and overall program cost efficiency. Executive teams want a simple summary connecting email performance to company growth.
Keep a consistent reporting cadence for your email analytics. Monthly reports build trust over time. Stakeholders learn to expect and rely on your data instead of requesting ad hoc updates.
Benchmarking Your Email Analytics Over Time
A single campaign report tells only part of the story. Email analytics gains real power when marketers compare results across months and quarters. Track a rolling average of your open rate and click-through rate instead of judging one send in isolation.
Build a simple benchmark sheet inside your email analytics workflow. Record key metrics after every campaign. Note any major changes like a new subject line style or a redesigned template. This record helps you connect specific changes to specific shifts in performance.
Seasonal patterns also show up clearly through long-term email analytics tracking. Retail brands often see higher engagement around major shopping holidays. B2B teams often see lower engagement during summer months. Recognizing these patterns helps marketers set realistic expectations instead of panicking over a normal seasonal dip.
Compare your own email analytics history rather than chasing generic industry averages found online. Every list behaves differently based on its size, source, and audience. Your past performance offers the most reliable benchmark for future campaigns.
Related Concepts
Email analytics connects to several related marketing terms. Email deliverability describes how well emails reach the inbox instead of the spam folder. Email engagement describes overall subscriber interaction across opens, clicks, and replies. Email segmentation describes the practice of splitting a list into targeted groups based on behavior or demographics.
Marketing automation often works alongside email analytics. Automated flows like welcome series and cart abandonment emails rely on strong analytics to prove their value. A/B testing pairs naturally with email analytics as well, since every test needs reliable data to declare a winner.
FAQs About Email Analytics
What is a good open rate in email analytics? Most industries see average open rates between 15% and 25%. This number varies by industry and list quality. Compare your email analytics against your own historical data instead of chasing generic industry benchmarks.
How often should marketers review email analytics? Marketers should review email analytics weekly for quick fixes. Monthly reviews reveal broader trends. Quarterly reviews support bigger strategic decisions around content and segmentation.
Does open rate still matter after Apple Mail privacy changes? Open rate still holds some value as a directional signal. Apple Mail privacy changes inflate the number through automatic image loading. Email analytics teams should weigh click-through rate and conversion rate more heavily now.
What email analytics metric matters most for e-commerce brands? Revenue per email matters most for e-commerce brands. This metric ties email analytics directly to sales performance and campaign profitability.
Can small businesses benefit from email analytics? Yes, small businesses gain real value from email analytics. Even basic metrics like open rate and click-through rate help small teams improve content and timing without expensive tools.
How does email analytics improve deliverability? Email analytics tracks bounce rates and spam complaints closely. Marketers who monitor these numbers catch list quality problems early. This proactive monitoring protects sender reputation and keeps future emails landing in the inbox.
What is the difference between email analytics and email reporting? Email analytics involves the ongoing process of tracking and interpreting data. Email reporting involves packaging that data into a summary for stakeholders. Strong email analytics work supports clear and accurate email reporting.
Should marketers track email analytics for every single send? Marketers should track core email analytics metrics for every send. Deeper analysis with segmentation and testing works best for larger campaigns or recurring newsletters where patterns matter more over time.
Read More:-Why Resume Keywords Are Failing Your AI Hiring Strategy (And What to Do About It)
Conclusion

Email analytics turns every campaign into a learning opportunity. Track open rate, click-through rate, and conversion rate for a complete performance picture. Watch bounce rate and spam complaint rate to protect your sender reputation. Use revenue per email to connect your campaigns to real business results.
Set clear goals before every send. Review your email analytics on a regular schedule. Test your assumptions instead of guessing at what works. Marketers who commit to this process build stronger campaigns over time. Strong email analytics does not just measure success. It creates a repeatable path toward better results with every single send.
Treat your email analytics practice as an ongoing habit, not a one-time project. Revisit your dashboards after every major campaign. Adjust your strategy based on what the numbers show, not what you assume subscribers want. Teams that build this discipline into their routine see steady improvement across every metric, quarter after quarter.