

Introduction
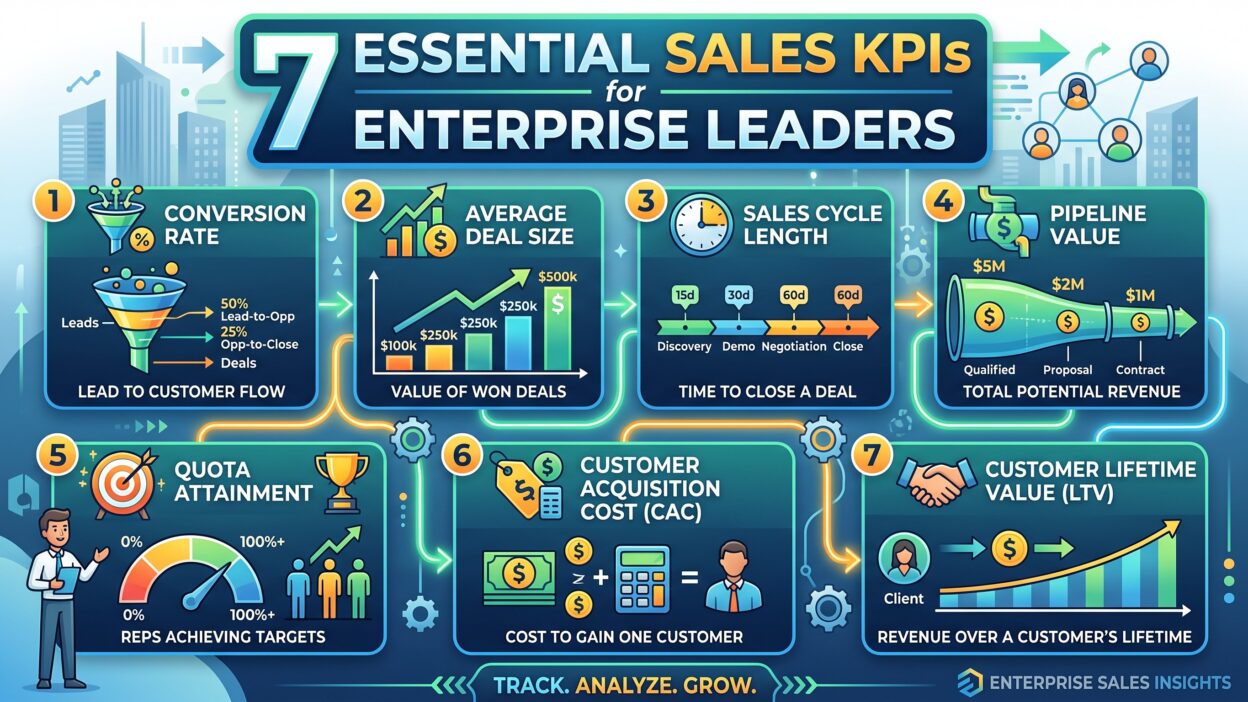
TL;DR Enterprise sales teams run on data, not gut feeling. A leader who tracks the wrong numbers steers the whole company off course. Sales KPIs give leaders a clear view of pipeline health, rep performance, and revenue trends. This guide breaks down seven essential metrics every enterprise leader needs on their dashboard. You will learn what each one measures, why it matters, and how to improve it across a large sales organization. By the end, you will know exactly which numbers deserve a spot on your weekly leadership review.
Table of Contents
What Are Sales KPIs and Why Enterprise Leaders Need Them
Sales KPIs are the measurable numbers that show how a sales team performs against its goals. A KPI turns a vague goal like “grow revenue” into a specific number leaders can track each week. Enterprise teams manage hundreds of reps across many regions. Without clear performance metrics, leaders lose sight of what drives results and what drains resources. A CEO asking “how is sales doing” deserves a real answer backed by numbers, not a hunch from the last board meeting.
The Role of Sales KPIs in Enterprise Growth
Large sales organizations move slowly without the right signals. A regional manager needs to know which reps hit targets and which ones fall behind. These metrics give that manager a shared language across every region and every team. Leaders use these numbers to spot problems early, before a bad quarter turns into a bad year. A board meeting built on real numbers also earns far more trust than one built on a manager’s gut feeling about how the quarter went.
How Sales KPIs Differ From Basic Sales Metrics
A metric is any number you track, like total calls made or emails sent. A KPI ties directly to a business goal and drives a real decision. Total calls made means little on its own. A KPI like win rate tells you if those calls actually convert into revenue. Enterprise leaders need this distinction to avoid drowning in data that leads nowhere.
A busy dashboard full of raw activity numbers looks impressive at first glance. Most of those numbers never change a single decision on the sales floor. A true KPI answers a direct question about growth, risk, or rep performance. Leaders who learn this difference build leaner dashboards that actually get used every week instead of ignored.
Sales KPI One: Monthly Recurring Revenue
Monthly recurring revenue tracks predictable income a company earns each month from active customers. This KPI sits at the center of most enterprise sales dashboards. A rising number signals healthy growth. A flat or falling number signals trouble long before it hits the full income statement.
What This KPI Measures
Monthly recurring revenue adds up every active subscription or contract a company holds that month. It strips out one time deals and refunds to show a true baseline. Enterprise leaders watch this number to judge the real health of the business, not just one big deal that closed by luck.
How to Improve This KPI
Sales teams grow this number through new deals, upsells, and lower churn. A rep who upsells an existing account adds revenue without the cost of a brand new deal. Leaders who track this number closely spot early churn signals and act before a customer walks away for good. A quarterly business review with top accounts often surfaces expansion opportunities long before a renewal date even shows up on the calendar. Teams that build this habit into their regular rhythm rarely get surprised by a sudden drop in recurring revenue. A steady cadence of these reviews also builds a stronger relationship with the account long before any renewal conversation starts.
Sales KPI Two: Customer Acquisition Cost
Customer acquisition cost shows how much a company spends to win one new customer. This number combines marketing spend, sales salaries, and tool costs across a full sales cycle. Enterprise leaders track this metric to judge if growth actually pays off or just burns cash. A business can grow revenue every quarter and still lose money if this cost climbs faster than the value each customer brings in.
What This KPI Measures
The formula divides total sales and marketing spend by the number of new customers won in that period. A rising cost often signals a market that grows harder to reach. A falling cost signals a sales motion that works well and scales cleanly across bigger deals.
How to Improve This KPI
Teams lower this cost through better lead targeting and shorter sales cycles. A rep who spends less time on unqualified leads closes more deals per dollar spent. Enterprise leaders who track this Sales KPI against customer lifetime value get a clear signal on real business health. Marketing teams that hand off cleaner leads to sales also cut this cost without adding a single extra dollar to the budget. A tighter handoff process between marketing and sales often saves more money than any new tool or headcount addition.
Sales KPI Three: Sales Cycle Length
Sales cycle length tracks the average time a deal takes from first contact to signed contract. Long cycles tie up cash and rep time. Short cycles free up capacity for more deals across the same quarter.
What This KPI Measures
This number tracks the days between first outreach and closed deal across every rep and region. Enterprise deals often run longer than small business deals due to more stakeholders and longer approval chains. Leaders compare this metric across teams to spot process gaps that slow deals down. A sudden jump in cycle length in one region often points to a specific blocker, like a new legal review step or a change in the buying committee.
How to Improve This KPI
Teams shorten this cycle through clear qualification criteria early in the process. A rep who disqualifies a bad fit fast saves weeks of wasted effort. Leaders who track this Sales KPI closely often find that faster cycles come from better discovery calls, not just more pressure on reps. Mapping out the buyer’s internal approval steps during the first call also helps a rep plan around delays before they even happen. A rep who knows about a legal review in week six stops being surprised by it in week eight.
Sales KPI Four: Win Rate
Win rate shows the percentage of deals a team closes out of every deal it pursues. This metric reveals how well a team qualifies leads and handles objections through a full sales cycle. A team can chase a large pipeline and still miss its number if this rate stays too low. Two reps can carry the exact same pipeline size and land in very different places once this one number gets compared.
What This KPI Measures
The formula divides closed won deals by the total number of deals a team pursued in that period. A low win rate often points to weak qualification early in the funnel. A high win rate signals strong fit between the product and the accounts a team chases.
How to Improve This KPI
Teams raise this rate through sharper qualification and better competitive positioning. A rep who understands a buyer’s real pain closes more deals with less back and forth. Enterprise leaders who track this Sales KPI by rep spot coaching opportunities across the whole team fast. Recording and reviewing lost deal calls also reveals patterns that a simple spreadsheet number never shows on its own.
Sales KPI Five: Customer Lifetime Value
Customer lifetime value estimates the total revenue a company earns from one customer across the full relationship. This metric shapes decisions on pricing, retention, and which accounts deserve extra attention. A business with high lifetime value can afford to invest more upfront to win the right accounts.
What This KPI Measures
The formula multiplies average revenue per customer by the average length of the relationship in months or years. A high lifetime value justifies a higher acquisition cost for that same account type. Enterprise leaders use this number to decide which segments deserve the biggest sales investment.
How to Improve This KPI
Teams grow this number through upsells, renewals, and stronger account management. A customer success team that catches problems early keeps accounts active longer. Leaders who track this Sales KPI next to acquisition cost get a full picture of account profitability over time. Segmenting accounts by industry often reveals which verticals carry the highest lifetime value and deserve a bigger share of the sales budget. A single high value vertical can quietly fund growth in three or four smaller segments that struggle to break even on their own.
Sales KPI Six: Pipeline Coverage Ratio
Pipeline coverage ratio compares total pipeline value against the revenue target for that period. This metric tells leaders if a team has enough deals in motion to hit its number. A thin pipeline late in a quarter almost always signals a rough quarter ahead.
What This KPI Measures
Most enterprise teams aim for pipeline worth three to five times the quarterly target. A ratio below this range signals a real risk of missing the number. A ratio far above this range may signal weak qualification padding the pipeline with deals that never close.
How to Improve This KPI
Teams build stronger pipeline through better prospecting and clearer account targeting. A rep who prospects consistently avoids a last minute scramble at quarter end. Leaders who track this Sales KPI weekly catch coverage gaps early enough to fix them before the quarter closes. Splitting this ratio by rep also reveals which team members need extra prospecting support before a slow quarter turns into a missed target. A manager who spots a thin pipeline in week three still has time to act, while one who waits until week ten usually cannot.
Sales KPI Seven: Quota Attainment
Quota attainment shows the percentage of reps who hit their assigned sales target in a given period. This metric reveals whether quotas sit at a realistic level across the whole team. A big gap between top and bottom performers often points to a training issue rather than a talent issue.
What This KPI Measures
The formula divides the number of reps who hit quota by the total number of reps on the team. A rate far below half often signals quotas set too high or weak training. A rate near full attainment may signal quotas set too low for real stretch goals.
How to Improve This KPI
Leaders raise this rate through better onboarding and clearer sales playbooks. A new rep who ramps faster hits quota sooner and stays motivated longer. Teams that track this Sales KPI by tenure spot exactly where training gaps slow new hires down. Pairing a struggling rep with a top performer for a few weeks often closes the gap faster than any formal training course. This kind of peer coaching costs almost nothing and often works better than a new course or certification.
How to Track Sales KPIs Effectively
Picking the right seven Sales KPIs means nothing without a system to track them well. Enterprise teams need a process that turns raw numbers into real action every week.
Choose the Right Sales Dashboard
A good dashboard pulls data straight from the CRM without manual entry. Manual tracking falls behind fast across a large sales org. Pick a tool that updates numbers in near real time so leaders always see current metrics instead of last month’s stale snapshot.
Set Realistic Benchmarks
Every enterprise varies by industry, deal size, and sales motion. Copy a benchmark from a different industry and you risk chasing the wrong target. Build benchmarks from your own historical data first. Adjust these benchmarks as the market shifts and your metrics mature over time.
Review Sales KPIs on a Regular Cadence
Weekly reviews catch problems before they become a bad quarter. Monthly reviews suit slower moving metrics like customer lifetime value. Pick a cadence that matches how fast each number actually moves. Consistent review turns these metrics from a report nobody reads into a real management tool.
Break Numbers Down by Rep and Region
A single company wide average often hides real problems inside specific teams. One region might carry the whole quarter while another quietly misses every target. Break each metric down by rep, by team, and by region before you draw any conclusion. This deeper view helps a leader coach the right person instead of applying a blanket fix that helps nobody.
Common Mistakes Enterprise Teams Make with Sales KPIs
Even strong teams fall into traps that weaken the value of their tracking efforts. Spotting these mistakes early saves months of wasted effort.
Tracking Too Many Metrics at Once
A dashboard with thirty metrics overwhelms every rep and manager who looks at it. Nobody acts on thirty numbers at once. Pick the seven core metrics that matter most to your business and ignore vanity numbers that look nice but drive no real decision.
Ignoring Context Behind the Numbers
A single number without context tells an incomplete story. A dip in win rate might come from a tough new market, not weak reps. Leaders who read these numbers without context often blame the wrong cause and fix the wrong problem entirely.
Chasing Short Term Numbers Over Long Term Health
A team can hit every short term target and still damage the business over time. A rep who discounts heavily to close a deal fast hurts margin for months afterward. Leaders need to weigh fast wins against long term account health before they celebrate a strong month. A quarter that looks great on paper can still hide problems that surface only after a customer churns.
Best Practices for Enterprise Sales KPI Programs
A strong program turns these metrics into a habit the whole company trusts, not a report that sits ignored in an inbox.
Align KPIs Across Departments
Sales, marketing, and customer success need shared numbers, not separate scorecards that conflict with each other. Aligned metrics remove finger pointing between teams during a tough quarter. Everyone works from the same source of truth instead of competing spreadsheets. A marketing team that tracks a different definition of a qualified lead than sales creates confusion the moment a report goes to leadership.
Automate Data Collection
Manual entry introduces errors and wastes rep time better spent selling. Automated systems pull data straight from calls, emails, and CRM fields without extra clicks. This automation keeps every number accurate and frees reps to focus on actual deals instead of paperwork. A rep who spends an hour a day on manual updates loses that hour every single week across a whole year.
Tie KPIs to Compensation Carefully
Comp plans built around the wrong metrics create bad incentives fast. A plan built only around deal count might reward reps for closing bad fit deals. Tie compensation to a healthy mix of metrics that reward real, sustainable revenue growth. A plan that blends win rate with lifetime value pushes reps toward deals that stick around, not just deals that close.
Frequently Asked Questions
What are the most important Sales KPIs for enterprise leaders?
Enterprise leaders usually track monthly recurring revenue, win rate, and pipeline coverage as core metrics. The right mix depends on your business model and sales cycle length.
How many Sales KPIs should a sales team track at once?
Most experts recommend five to seven core metrics per team. Tracking too many numbers dilutes focus and slows down real decisions.
How often should enterprise teams review their Sales KPIs?
Fast moving metrics like pipeline coverage deserve a weekly review. Slower metrics like customer lifetime value work well on a monthly or quarterly cadence.
Can small sales teams use the same Sales KPIs as large enterprises?
Small teams can track the same core Sales KPIs at a smaller scale. The benchmarks and targets will differ based on team size and deal volume.
What tools help enterprise teams track Sales KPIs?
Most enterprise teams use their CRM paired with a dedicated analytics or dashboard tool. The best tools pull data automatically and update these numbers in near real time.
Do Sales KPIs change based on industry?
Yes, industry shapes which metrics matter most for a given business. A subscription business leans on recurring revenue while a project based business leans more on deal size and cycle length.
Should Sales KPIs stay the same all year?
Most enterprise teams keep the same core set through a full year for fair comparison. Leaders can still add a temporary metric during a big product launch or a new market push, then drop it once that goal gets met.
Read More:-What Is a Marketing Qualified Lead (MQL)?
Conclusion

Enterprise sales teams grow faster when leaders track the right numbers instead of every number available. Seven core Sales KPIs give a clear view of pipeline health, rep performance, and real revenue growth. Start with monthly recurring revenue, acquisition cost, and win rate as your foundation. Add pipeline coverage, cycle length, lifetime value, and quota attainment to round out the full picture. Review these Sales KPIs on a steady cadence and tie them to real decisions, not just a report nobody reads. Teams that build this habit spot problems early and fix them before a bad quarter turns into a bad year. Start small, pick your seven numbers, and build the review habit before you add anything else to the dashboard.